


Technical Articles
Article 1 : logiCAL - how to read calibration report?
Calibration Report is automatically created just after the monitor calibration process of
logiCAL software is finished.
It is used for internal evaluation to confirm that monitor is correctly working and the monitor calibration was successfully finished.
If some errors are to be found, we will investigate the cause and fix the problem.
For the customer point of view, this report will be enclosed in the box of the product,
so they can confirm that the monitor is properly calibrated in the factory before shipment.
But this report can be used not only as the certification of the monitor calibration,
but also to confirm the ability of the monitor, which could be some help to use the monitor for color critical tasks.
In this article, you can find how to read the report in technical aspects.
Choice:
How to read Calibration Report
Calibration Report is automatically created just after the monitor calibration process of logiCAL is finished. It is used for internal evaluation to confirm that monitor is correctly working and the monitor calibration was successfully finished. If some errors are to be found, we will investigate the cause and fix the problem. For the customer point of view, this report will be enclosed in the box of the product, so they can confirm that the monitor is properly calibrated in the factory before shipment. But this report can be used not only as the certification of the monitor calibration, but also to confirm the ability of the monitor, which could be some help to use the monitor for color critical tasks. In this article, you can find how to read the report in technical aspects.
Information table
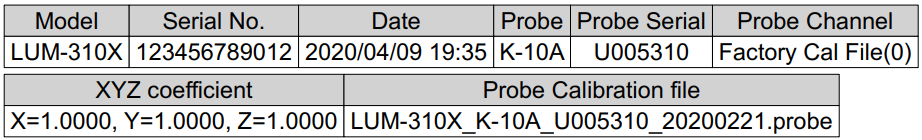
Information table shows the condition how the calibration was performed, especially probe related information.
Adding to Probe name, serial number, the table shows calibration information of the probe.
Probe Channel
If probe has a calibration channel inside, the selection of the channel will be shown. If the Probe Calibration file was selected, which is TVLogic original probe profile, it should be default.
XYZ coefficient
If the calibration was performed with XYZ adjustment coefficients, the parameter will be shown here. Default values is 1.0, so in this case, any extra parameter was not used. This parameter will be created by the visual matching of the monitor or D65 light source, and consecutive measurement. When you are going to evaluate this monitor, you have to use multiple measured XYZ values by these coefficients to get correct color values comparable with the standard.
Probe Calibration file
If the calibration was performed with probe calibration file which was provided TVLogic, the name of the file will be shown here. This calibration file can calibrate the probe not by 4-color matrix provided by the probe manufacturer, but by more complicated method to get better result for entire color space measurement. Each calibration file is targeted for the specific type of the monitor. It can not be used for other type of monitors.
Gray Tone Reproduction(SDR)
The first page is for the evaluation of grayscale tone reproduction under SDR setting. (BT.709/2.4 D65 100nits)
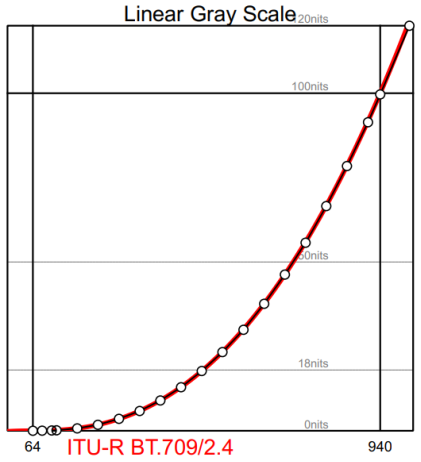
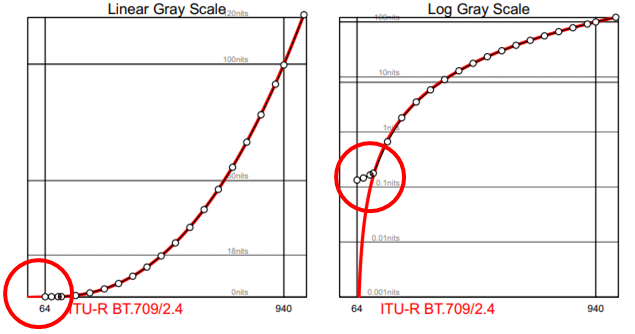
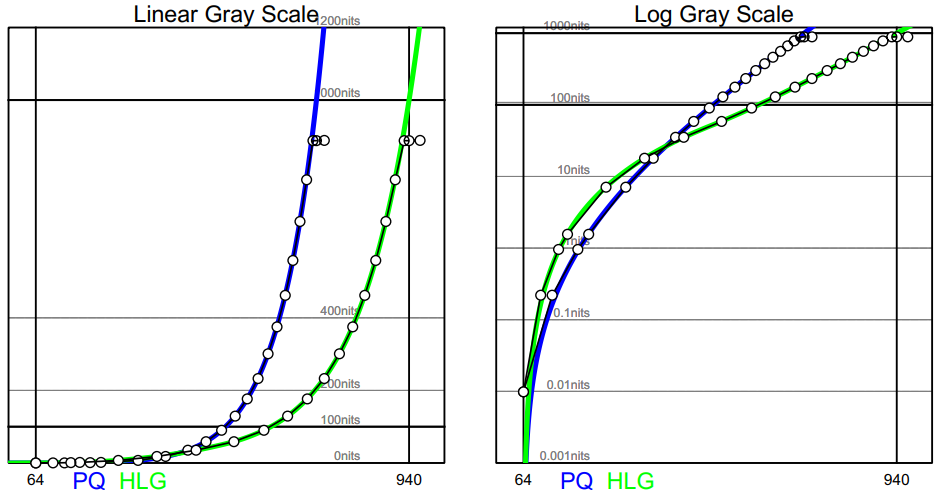
Linear Gray Scale
This graph shows the relationship of input (code value) versus output (gray scale luminance). Horizontal axis shows the 10bit code values from 0 to 1023 and vertical axis is linear luminance from 0 (zero) to 120nits. Red curve is the target curve calculated by BT.709/2.4 gamma specification. White circles are the actually measured values after calibration. You can confirm how good the gray scale is reproduced by this graph. This graph is especially suitable for the confirmation of highlight reproduction.
Log Gray Scale
This graph also shows the relationship of input (code values) versus output (gray scale luminance), but now the vertical axis is expressed in log scale. This graph is especially suitable for the confirmation of shadow reproduction. The graph below shows very good shadow, down to 0.001nits for black level, the monitor creates very close value towards the target.
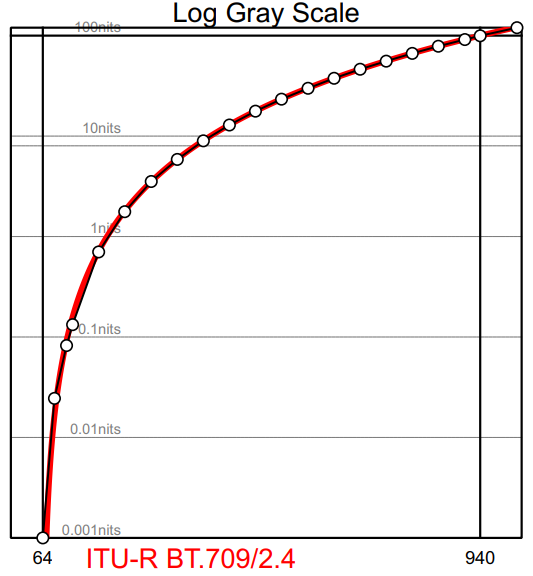
The graphs below shows the importance of confirming the gray scale reproduction by log-scale graph. You can find this monitor's darkest shadow (minimum black level) is around 0.1nits and cannot reach to desired 0.001nit. But the linear graph on the left cannot show you this limitation because of the compression of the shadow under vertical linear scale.
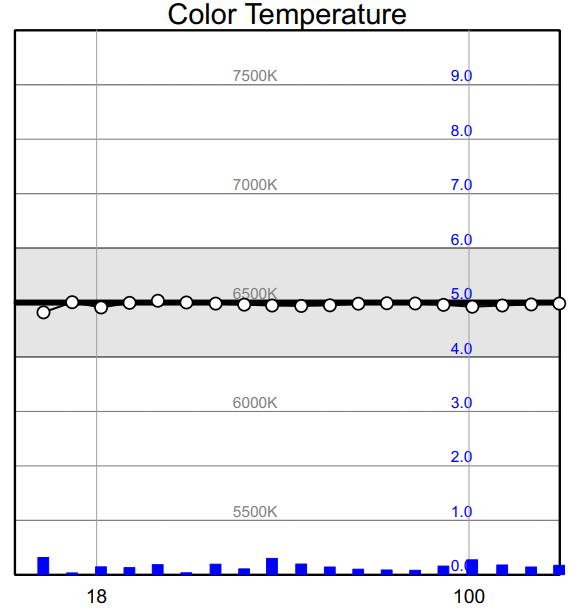
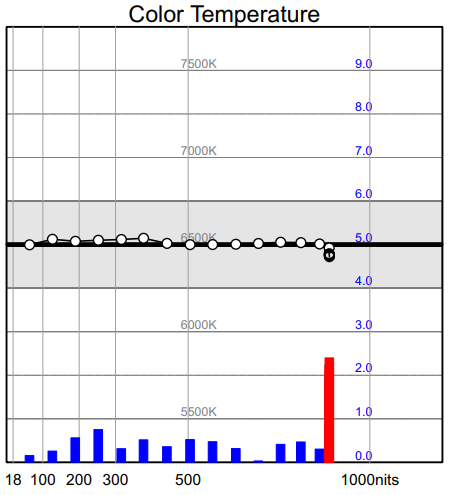
Color Temperature Graph
This graph shows two different unit values in the same graph. Both unit values are plotted versus luminance in nits. One is the color temperature from 5000K to 8000K in vertical axis, with the notation in gray character around the middle of the graph. Target value is 6500K, in the middle of the graph, with the thick black line. The measured values are plotted in white circles. This graph shows the color temperature is well calibrated to 6500K from shadow to highlight.
Another unit value is deltaE in deltaE2000, which represents the amount of errors (color difference) between the actual measured color and the target color. TVLogic calibration requires less than 2.0 for all of the gray colors.
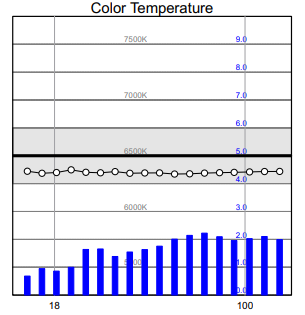
Here is an example for poor gray scale reproduction. This graph shows color temperature is shifted to lower temperature, and deltaE to the target color is rather bigger, around 2.0. This result itself does not mean unusable, but not desirable. This result can be caused by lack of aging time (warming) before the calibration, or by using wrong probe profile.
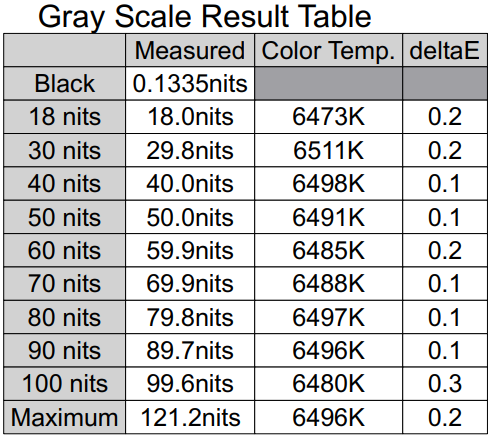
Gray Scale Result Table
This table shows the numerical result of luminance, color temperature and deltaE (color difference). You can confirm actual highlight and shadow numerically in luminance and color temperature values.
Color Reproduction Evaluation(SDR)
The second page is for color reproduction evaluation under SDR setting.
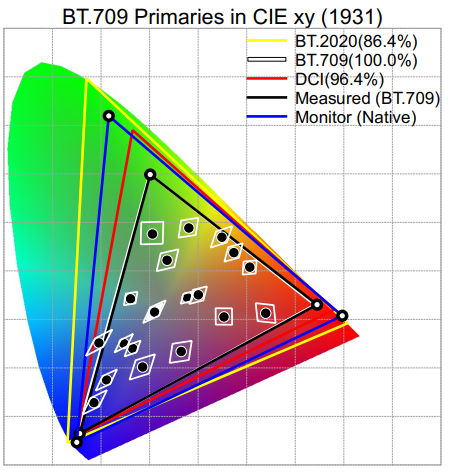
BT.709 Primaries in CIE xy(1931)
This graph shows primaries for major color standards and measured monitor primaries. The black triangle shows the monitor's native primaries, and the black triangle shows the monitor's BT.709 primaries.
Primaries of BT.2020 are in yellow triangle, DCI in red and BT.709 in white. The gamut coverage ratio is calculated by the actual measurement result of this specific monitor and written in the legends. This number represents how much amount of BT.2020 colors or DCI-P3 colors can be reproduced correctly on this monitor.
Adding to color standard primaries, the measurement result of Macbeth-Gretag's 24 colors is also plotted. Black circles are the color coordinates of the measured colors, and the quadrangle show the areas within deltaE 4.0 range of each coordinates. If all of the black circles are inside the quadrangle and close to the center, the color reproduction of the 24 colors are very correct. The numerical results are available at the Color Checker page.
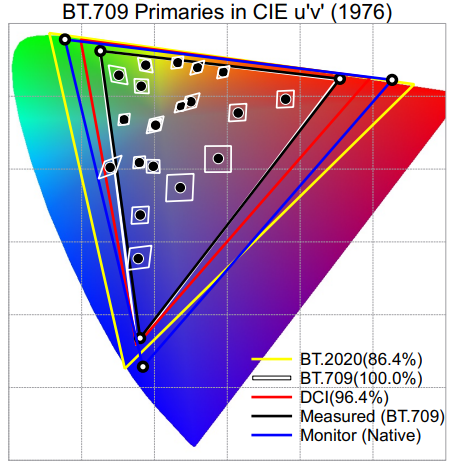
BT.709 Primaries in CIE u'v'(1931)
CIE u'v' (or CIE UCS) is an advanced 2-dimensional colors space which was introduced in 1976 in order to minimize the gap between numerical color difference and perceptual color difference of CIE xy (1931) color space.
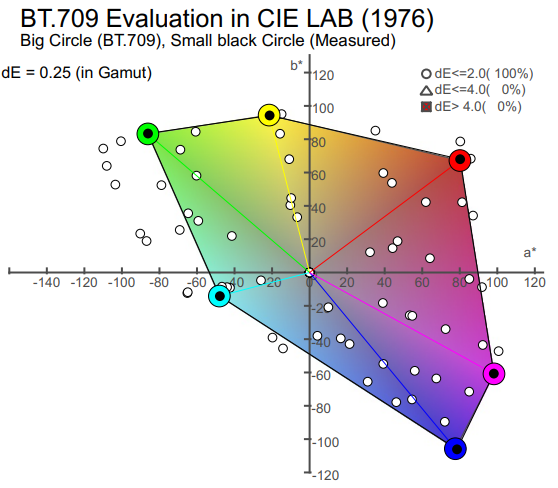
BT.709 Evaluation in CIE LAB(1976)
Next graph is the evaluation of primaries and various colors in L*a*b*. The graph is a*b* plane. Center is neutral and angles is hue, and the distance from the center to a specific color means saturation. Big colored circles, in red, green, blue, cyan, magenta and yellow are position of BT.709 primaries and secondary colors. Inside of this hexagon is colored to help showing the target gamut and the relationship of the position and colors. You can find the black small circles inside of the colored big circle. These small black circles are the actual measured position. Small white shapes are positions of the various test colors measured. The shape expresses the size of the error of the color. Circle means less than 2.0 which means very good result. On the legends, there is the explanation of the population of the error. In this case, all of the evaluated colors are less than 2.0.
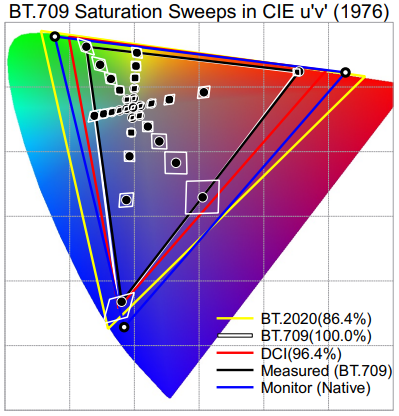
BT.709 Saturation Sweeps in CIE u'v'(1976)
Next graph is to confirm the smooth transition from red to white, green to white and blue to white. Graph notation is the same as previous xy graphs. By confirming all measured colors are in the quadrangle, there is no problem for reproducing edge colors.
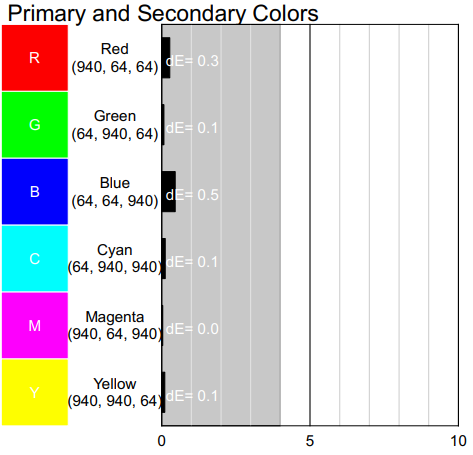
Primary and Secondary Colors
This graph shows deltaE2000 values for primary and secondary colors. They are equivalent colors in CIE LAB graph. In this sample graph, you can confirm that errors (color difference between measured versus target) are very small for BT.709 primaries and secondaries.
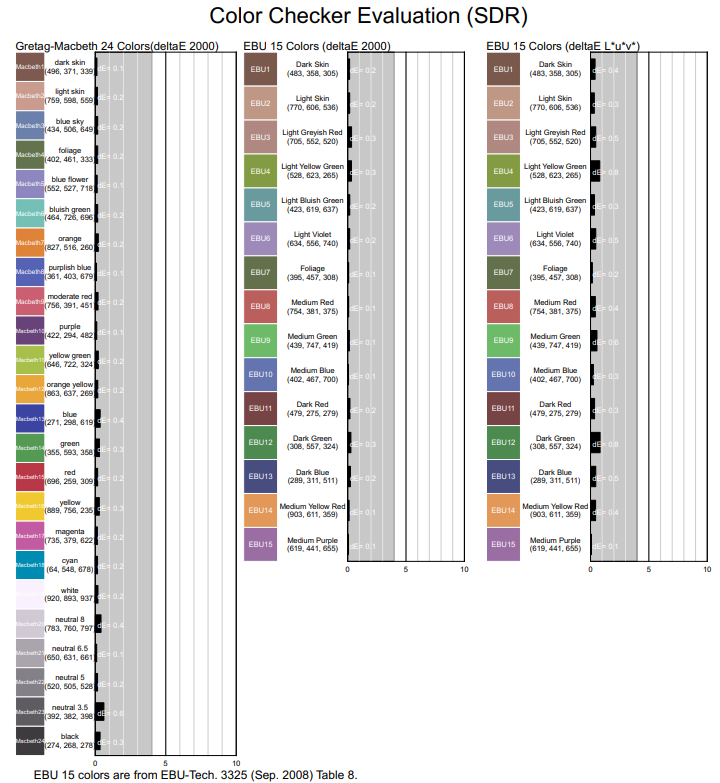
Color Checker Evaluation(SDR)
The third page is for the Color Checker Evaluation. The selected colors are Gretag-Macbeth 24 colors and 15 EBU Test Colors. All of the result was obtained BT.709/2.4 D65 setting and feeding code values written on the each color below. DeltaE was calculated by deltraE2000 method and plotted as a bar graph and number. To assist the understanding, each color name has similar color background but please note that they are just assistance not correct colors.
Only for EBU colors, deltaE L*u*v* is also calculated and plotted to help understanding the error values as specified in EBU documents. In general, deltaE L*u*v* error values are larger than deltaE2000 results due to different color appearance model. We recommend using deltaE2000 since the calculation is based on CIE LAB colors space, while deltaE L*u*v* is based on 3-dimensional color space stemmed from the old CIE uv color space.
Gray Tone Reproduction(HDR)
The 4th page is for the evaluation of gray tone reproduction under HDR setting. (1000nits BT.2020 HLG/PQ)
This graph shows the relationship of input (code values) versus output (gray scale luminance). Horizontal axis shows the 10bit code values from 0 to 1023 and vertical axis is linear luminance from 0 (zero) to 1200nits. Left graph's vertical axis is linear scale and right graph's axis is log scale. As we explained at SDR gray scale section, linear scale graph is suitable for evaluation of the highlight, log scale graph is suitable for the evaluation of shadow reproduction.
In each graph, two curves are plotted. Green one is for HLG and blue one for PQ. White circles on the curve are measured values, and they are well reproduce the target values. In the left graph, we can observe clipping in the highlight to hit the maximum value below 1000nits. It may be due to the monitors limitation or comes from using wrong probe profile. On the right graph, we can observe that the minimum value, which is dark shadow, is above the targeted curve, which is expected 0.001nits, but plotted around 0.01nits. It means black is a little bit shifted from pure black. The shadow level is different from model to model. Some displays will have shadow mode which expands the shadow dynamic range, much more darker black to view shadow detail, instead of limiting maximum brightness.
Color Temperature Graph
This graph shows two different unit values in the same graph. Both unit values are plotted versus luminance in nits. One is the color temperature from 5000K to 8000K in vertical axis, with the notation in gray character around the middle of the graph. Target value is 6500K, in the middle of the graph, with the thick black line. The measured values are plotted in white circles. Above result shows the color temperature is well calibrated to show around 6500K from shadow to highlight.
Another unit value is deltaE in deltaE2000, which represents the amount of errors compared to the target color, which is drawn in blue bar graph. Red bar means the target color was out of the monitor gamut. TVLogic calibration requires less than 2.0 for all of the gray colors for in gamut colors.
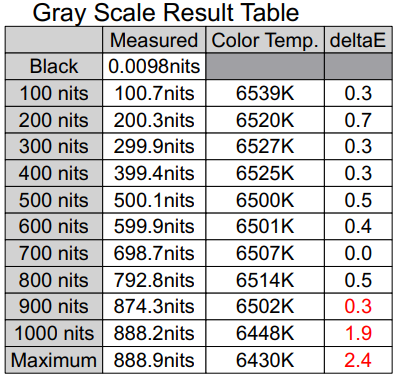
Gray Scale Result Table
This table shows the numerical result of luminance, color temperature and deltaE (color difference). You can confirm actual highlight and shadow numerically in luminance and color temperature values.
Color Reproduction Evaluation(HDR)
The fifth page is for color reproduction evaluation under HDR setting.
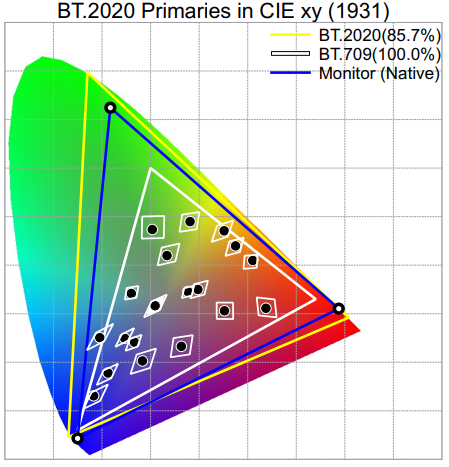
BT.2020 Primaries in CIE xy(1931)
This graph shows primaries for major color standards and measured monitor primaries. The black triangle shows the monitor's native primaries, and the black triangle shows the monitor's BT.709 primaries.
Primaries of BT.2020 are in yellow triangle, DCI in red and BT.709 in white. The gamut coverage ratio is calculated by the actual measurement result of this specific monitor and written in the legends. This number represents how much amount of BT.2020 colors or DCI-P3 colors can be reproduced correctly on this monitor.
Adding to color standard primaries, the measurement result of Macbeth-Gretag's 24 colors is also plotted. Black circles are the color coordinates of the measured colors, and the quadrangle show the areas within deltaE 4.0 range of each coordinates. If all of the black circles are inside the quadrangle and close to the center, the color reproduction of the 24 colors are very correct. The numerical results are available at the Color Checker page.
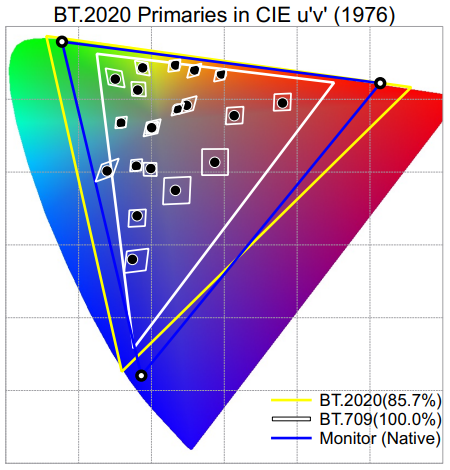
BT.709 Primaries in CIE u'v'(1931)
CIE u'v' (or CIE UCS) is an advanced 2-dimensional colors space which was introduced in 1976 in order to minimize the gap between numerical color difference and perceptual color difference of CIE xy (1931) color space.
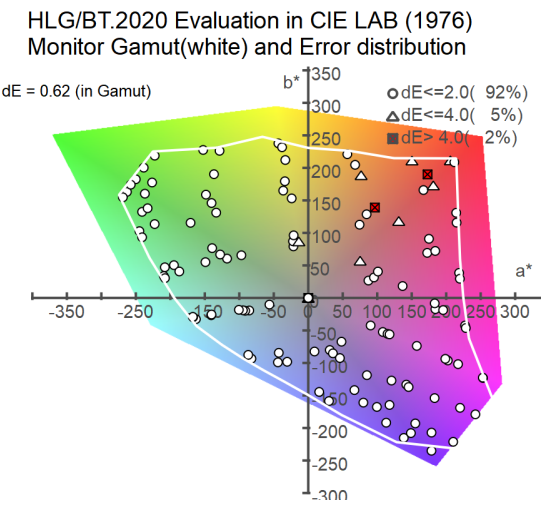
HLG/BT.2020 Evaluation in CIE LAB(1976)
Next graph is the evaluation of primaries and various colors in L*a*b*. The graph is a*b* plane. Center is neutral and angles is hue, and the distance from the center to a specific color means saturation. Colored area is entire gamut of HLG/BT.2020. The area surrounded by white lines are the roughly calculated monitor's gamut. Outside of the monitor's gamut colors are mapped onto the surface of the monitor's gamut, while preserving the color hue of its original color. Small shapes are evaluated colors which position is decided by the mapped target. 146 Test colors were chosen from entire gamut. The errors, which is calculated in deltaE2000 will be used to decide the shape of these plots. Circle means less than 2.0, triangle means then 4.0 and colored/crossed cube means above 4.0 values. The distribution ratio is shown in the legend of the graph. You can confirm the preciseness of the result for entire gamut.
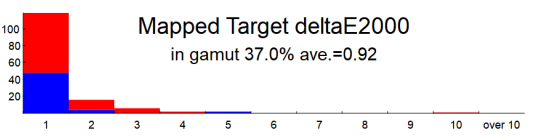
Histogram of deltaE2000 and deltaH errors
Following are the histogram graphs.
First one is the histogram of deltaE2000 for 146 Test colors. These colors are chosen from entire HLG/BT.2020 gamut. Some of the colors are outside of the monitor's gamut and the deltaE2000 was calculated between mapped colors and measured colors. These results are shown in red bar. Blue bar is the colors in monitor's gamut. In this case, the colors inside monitor's gamut are 37.0%, and average deltaE2000 including inside and outside gamut was 0.92. The ratio 37.0% can be used as the barometer for the size of monitor's gamut, but not has the meaning of correct volume.
This result shows all of the colors are reproduced very close to the target. If the calibration was not successfully performed or some issue happens in the monitor hardware, the distribution will change to higher values and average deltaE will be much bigger. TVLogic decides the acceptable average deltaE2000 values monitor to monitor and if the result exceed the threshold, the monitor will not be shipped.
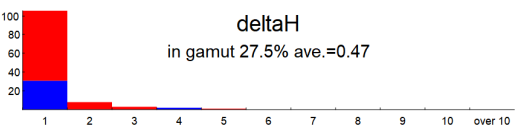
Next histogram is the deltaH distribution. Errors can be calculated as brightness error, saturation error, and hue error. Our algorithm to map the outside gamut colors into the monitor's gamut is to reduce the brightness and/or color saturation while preserving the color hue, to find the best place on the surface of the monitor's gamut. So the hue error could be the barometer how the mapping algorithm and calibration are working properly. The unit of horizontal axis is degree. The evaluated colors are 120 colors, eliminated gray colors. The meaning of the colors are the same as deltaE2000 histogram and the ratio of inside gamut colors are 27.5%. The average deltaH for all of the colors is 0.47. It means, almost all of the colors are reproduced the same hue with original targeted colors.
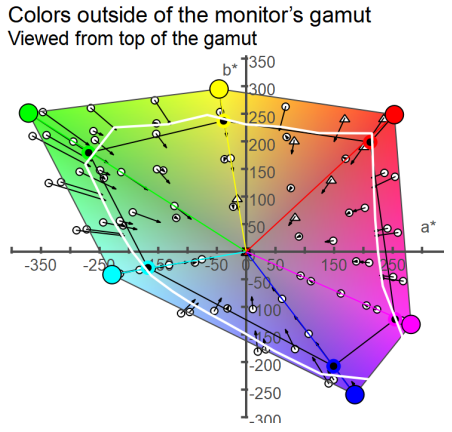
How the colors outside of the monitor's gamut are mapped into the monitor's gamut
Following graph shows our gamut mapping algorithm result. The coordinates are a* vs b* in L*a*b* color space. Colored background shows the entire gamut of HLG/BT.2020. The big circle on the edge, with red, yellow, green, cyan, blue and magenta are primary and secondary colors in HLG/BT.2020 color space. At this moment, there is no commercial monitor that covers the ultra-wide color gamut of BT.2020, so these colors outside of monitor's gamut are mapped onto the surface of the monitors' gamut which is shown as black circle with surrounded by the original color outer line. To help find any small rotation of the hue, lines are connected from original primary and secondary to neutral origin.
Targeting outside of the monitor gamut colors are plotted in small shapes, circle or triangle. Inside gamut colors are not plotted. The shapes position was calculated by original targeted color value. Each shape is attached with arrow, which top is heading to the measured value, which was mapped in the monitor's gamut. The direction of the arrow means direction of the color change. You can observe all arrows are heading towards the center, neutral gray, which means very little change in color hue occured.
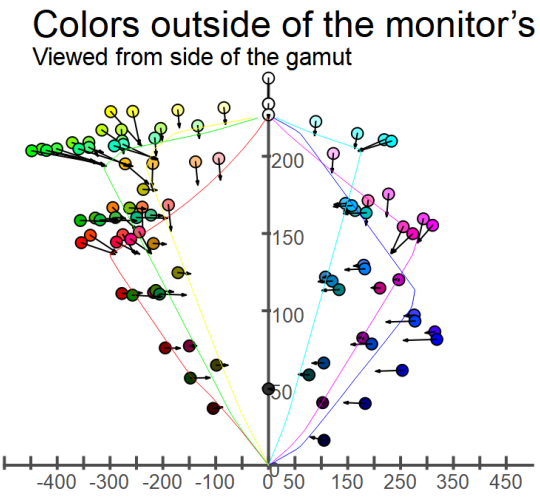
Next diagram is observing the L*a*b* color space from the side. Vertical axis is the brightness, black on the bottom to maximum white to the top. Horizontal axis is saturation, distance from neutral. The sign, plus and minus has no meaning. Red, green, yellow, blue, cyan and magenta are lined for most saturated colors in each color hue and each brightness. The triangle which consists of color line and neutral vertical line, is the monitors gamut for the color hue.
Plotted colors are outside of the monitor gamut colors and the top of the arrow attached with each circle, is the position of the mapped color(using measured value). The shape color will assist you which monitor gamut hue is the close but the colors are distributed all direction, so it can be just an assist. But you can observe that every colors are mapping close to the surface of the gamut of each hue. All of the colors are controlled and decently treated.
Color Checker Evaluation(HDR)
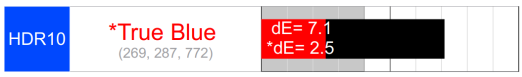
The last page is for the Color Checker Evaluation. The selected colors are Gretag-Macbeth 24 colors and 15 EBU colors + 10 EBU HDR colors. All of the result was obtained BT.2020/HLG D65 setting and feeding code values written on the each color below. DeltaE was calculated by deltraE2000 method and plotted as a bar graph and number. To assist the understanding, each color name has similar color background but please note that they are just assistance not correct colors. Only for EBU colors, deltaE L*u*v* is calculated and plotted. In general, error numbers are larger than deltaE2000 results.
Sometimes you may observe red named color result with partially red error bar. It means this color target is outside of the monitor gamut and deltaE was calculated both for original color and mapped inside of the monitor's gamut color. DeltaE for mapped color is shown in red bar and as *dE with the number.
In general, deltaE L*u*v* error values are larger than deltaE2000 results due to different color appearance model. We recommend using deltaE2000 since the calculation is based on CIE LAB colors space, while deltaE L*u*v* is based on 3-dimensional color space stemmed from the old CIE uv color space.